Stat 226 - Lecture 2

01/16/14

Announcements

  • “Quiz” 1 is available on Blackboard and is due Sunday (it's just a survey).
  • Homework 1 is now available on Blackboard and is due next week Thursday.
  • My office hours will be on Mondays at 12:00-1:50pm in Snedecor 1205.
    • Except for this upcoming Monday (MLK Day).
    • The full office hours schedule is up on Blackboard.
  • Any questions about the syllabus, Chapter 1 or Chapter 2?
  • Question: How much should KPacks charge for their backpack? More specifically, what is the average amount potential customers are willing to spend?
  • Population:
    • Potential customers.
  • Sample:
    • Fall 2013 STAT 226 section D students (in your case…your neighbors).
  • Parameter:
    • The average (or mean) amount potential customers are willing to pay.
  • Statistic:
    • The average (or mean) amount fall 2013 STAT 226 section D students (in your case…your neighbors) are willing to pay.

Digging Deeper

  • A population and sample could be any size that you wish…it really all depends on your question of interest.
    • However, your sample must be a subset of your population. That is, your sample should never contain something outside of your population.
    • Is this the case for the KPacks example???
    • Well, that probably depends on your definition of potential customer…
    • Even if everyone here is a potential customer, would this class be a good representation of all potential customers?
    • No, this is a case of convenience sampling. The statistic is probably not a good estimate of the parameter!

Diagram to Identify Variable Types

  • What type of variable is in the K-Packs example?
  • Let's get more practice with a worksheet

Random Variables...

  • What is a random variable? In other words, what makes a variable random? (Hint: the answer is quite simple)
    • If we have not observed the variable, then it is random!
    • A random variable represents our belief about possible values.
    • In general, capital letters denote a random variable and lower case letters denote an observed value.
    • For example, let x be the number of beers I consumed last night and X be the number of beers I consume this Friday.
    • With this framework, I can say: “What is the chance (or probability) that the # of beers I consume this Friday is larger than what I consumed last night?”

Processes

  • Fundamental to many business decisions. For example, monthly sales at company X is a process.
  • Predicting future sales can be incredibly difficult. In stat 326, you'll learn how to forecast.
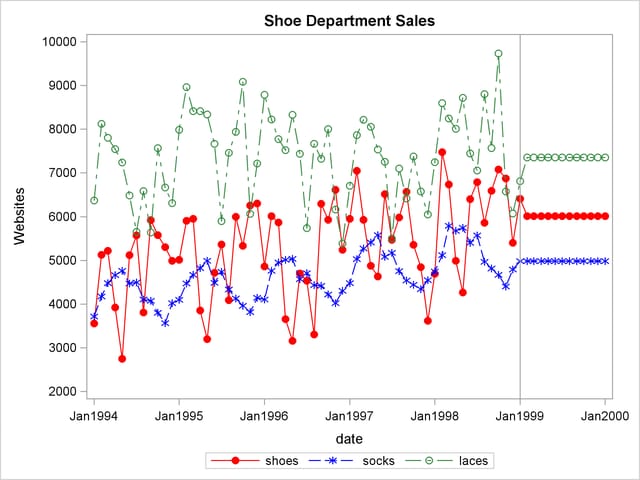
  • The graphic below contains similar time series data on monthly sales. What's the difference?
  • Is one graphic better than the other?
  • Quality is a matter of context (and sometimes preference). There is an entire field focused on these problems!

Data Visualization

There is more than one way to represent the same data.

  • Take away: Don't mislead your audience!

Less is more!

What's a 226 student to do?

  1. Identify the variable of interest.
  2. Identify whether the variable is categorical or quantitative.
  3. If variable is categorical (chapter 3), you're options are:
    • Bar chart (recommended)
    • Pareto chart (recommended)
    • Pie chart (not recommended)
  4. If variable is quantitative (chapter 4), you're options are:
    • Histogram (good for examining a single distribution)
    • Boxplot (good for comparing multiple distributions)